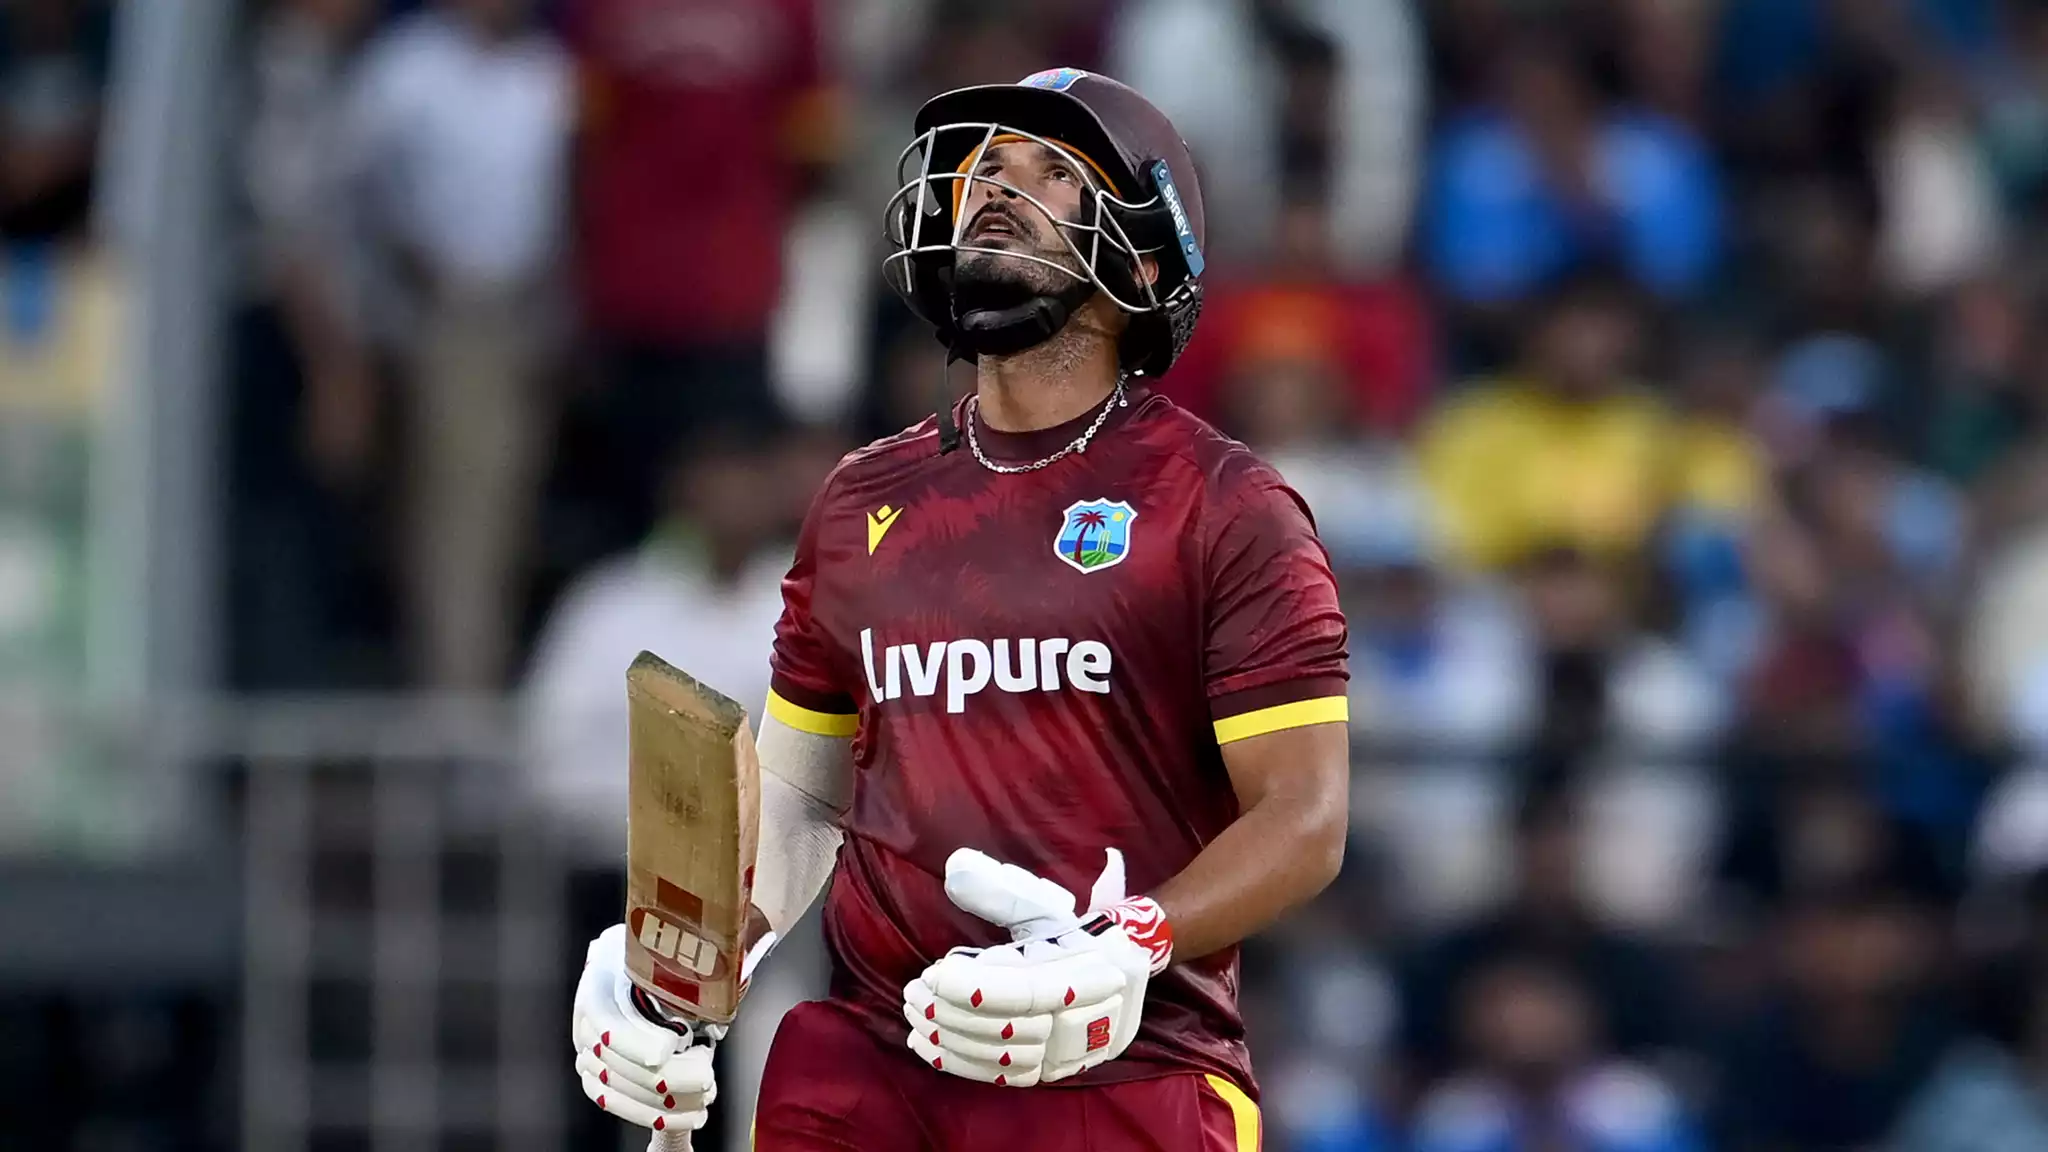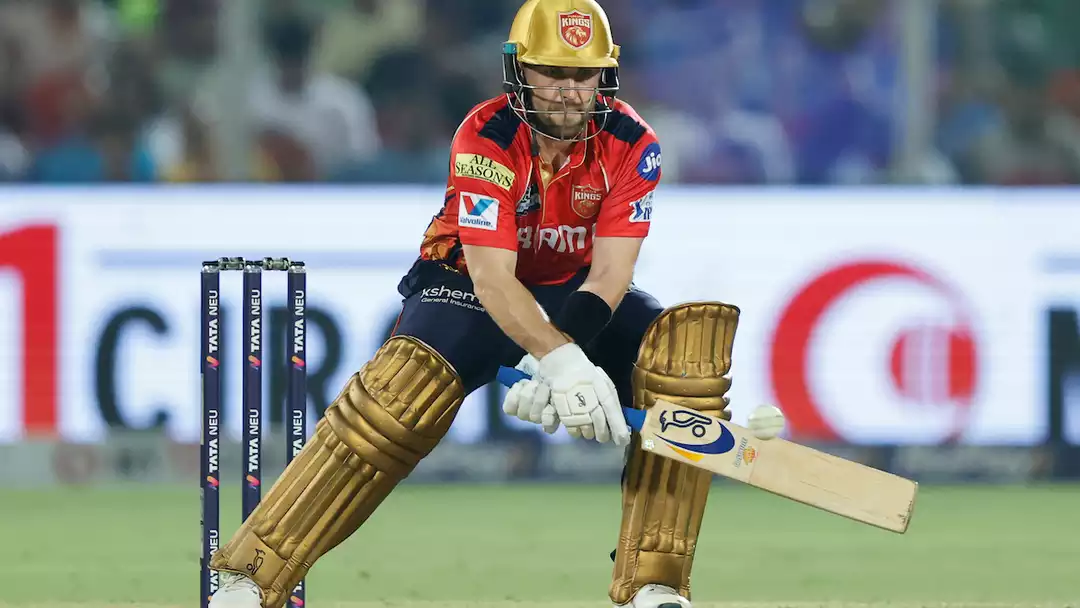
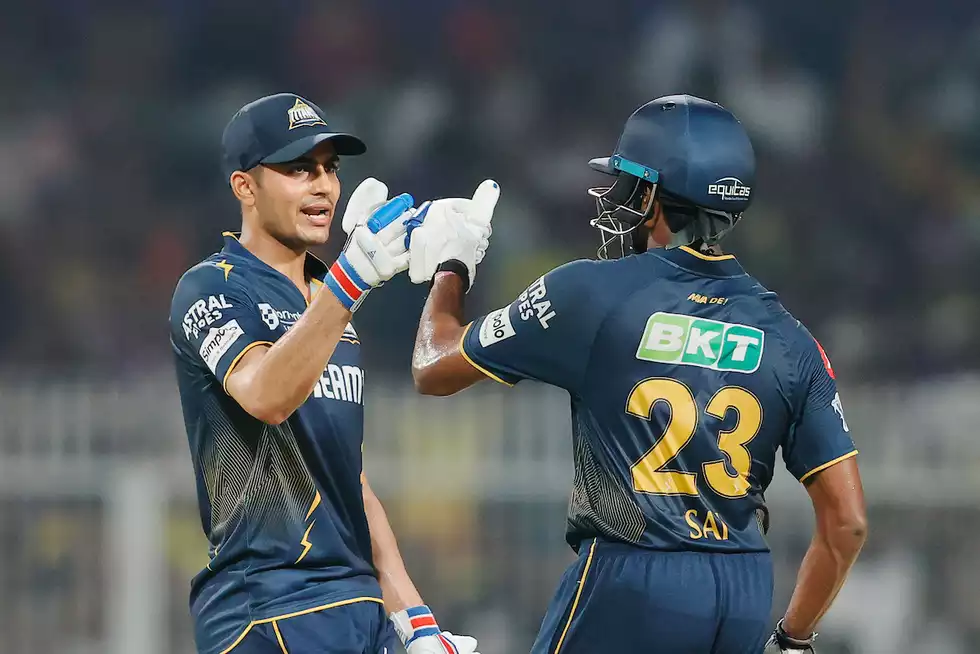
For IPL 2025 alone, there is no real challenger for the best top-three on show. 51 matches into the season, Shubman Gill, Sai Sudharsan and Jos Buttler win that battle hands down. Their unparalleled supremacy though makes one wonder: Is it the best ever in an IPL edition?
Gill, Sudharsan and Buttler currently take three of the top-four spots for most runs in IPL 2025, with the second-placed Suryakumar Yadav having played an innings more. The trio has contributed a staggering three-fourths (75.9%) of the team runs excluding extras, and all have been near-equal partners-in-crime: Sudharsan (26.6%), Buttler (24.8%) and Gill (24.5%). There hasn’t been a single game wherein at least one of them hasn’t gone past 50. Of all the team-wise top-order aggregates in the 18-year IPL history – 156 of them – only two boast a combined 50-plus average: GT (57.56 in 2025) and RCB (51.26 in 2016).
Orange cap leaderboard for IPL 2025 (after match 51)
| Player | Inns | Runs | Ave | SR | 50 | HS |
|---|---|---|---|---|---|---|
| Sai Sudharsan | 10 | 504 | 50.4 | 154.12 | 5 | 82 |
| Suryakumar Yadav | 11 | 475 | 67.85 | 172.72 | 3 | 68* |
| Jos Buttler | 10 | 470 | 78.33 | 169.06 | 5 | 97* |
| Shubman Gill | 10 | 465 | 51.66 | 162.02 | 5 | 90 |
| Virat Kohli | 10 | 443 | 63.28 | 138.87 | 6 | 73* |
Highest top-order averages in an IPL edition (by teams)
| Team | Year | Mat | Runs | Avg | SR | Bnd% | Dot% |
|---|---|---|---|---|---|---|---|
| GT | 2025 | 10 | 1439 | 57.56 | 161.32 | 22.53 | 26.2 |
| RCB | 2016 | 16 | 2102 | 51.26 | 156.74 | 21.17 | 29.9 |
| SRH | 2019 | 15 | 1726 | 46.64 | 143.71 | 18.23 | 31.8 |
| SRH | 2017 | 14 | 1559 | 43.3 | 136.15 | 17.64 | 34.1 |
| GT | 2023 | 17 | 1916 | 42.57 | 145.26 | 19.33 | 31.2 |
The other four entries in the above table make for an interesting analysis. Firstly, of all the 156, just two feature only three players used, PBKS in 2025 being the other (Priyansh Arya, Prabhsimran Singh and Shreyas Iyer). RCB in 2016 used five players in the top-three, with Virat Kohli contributing 46.3% of the top-order’s aggregate, followed by AB de Villiers (32.5%). Chris Gayle (10 times), KL Rahul (6 times) and Shane Watson (once) were the other players in RCB’s top-three that year, with Gayle enduring one of his most underwhelming campaigns, averaging 22.70 with seven single-digit scores.
Similarly, David Warner was the clear leader for SRH in 2017 and 2019, winning the Orange Cap on both occasions. GT’s second-highest run-scorer in IPL 2023 was Wriddhiman Saha (371), managing less than half of what Gill did (890). Gill’s 890 accounted for 46.5% of GT’s top-order runs that year, and 30.6% of the whole team aggregate. CSK had each of Michael Hussey, Murali Vijay and Suresh Raina crossing 400 in their victorious 2011 campaign, but lower down, S Badrinath (396) and MS Dhoni (392) were not far behind.
The PBKS top-order in 2025 leads the strike-rate parameter (180.05), closely followed by SRH and KKR in 2024: 180.05 and 174.12 respectively. The slam-bang approach upfront augurs well for PBKS with incredible batting depth: Marco Jansen and Azmatullah Omarzai were marked as No. 8 and No.9 in their most recent outing in Chennai. SRH and KKR’s 2024 numbers were largely dominated by openers.
This takes us back to how equally damaging each of Gill, Sudharsan and Buttler have been in 2025: all contrasting in their styles. While they top on averages, GT top-order also finds itself at sixth in terms of strike-rate among those 156 entries at an impressive (161.32). They have the lowest dot-ball percentage of all (26.2%), implying the highest frequency of scoring shots.
GT average a whopping 95.66 runs per wicket in the powerplay in IPL 2025, the highest for any team in an IPL edition ever, followed by 93.66 for CSK in their title win in 2023. It is worth noting that of the six wickets they have lost in the powerplay in 10 games so far, one has come via a runout. They have the second-lowest boundary percentage (22.77%) in the phase among all teams in IPL 2025, but that method serves as a prequel to the madness.
The 2022 winners have scored at 63.71 runs per wicket at 9.91 between Overs 7-15 in IPL 2025. Both those counts are highest ever by a team in any IPL edition. A reminder that 2024 remains the most run-filled edition still, with an average first innings score of 190, compared to this year’s 184.
Highest average runs/wicket in Overs 1-6 in an IPL edition
| Team | Year | Mat | Wkts | Avg | RR | Dot% | Bnd% |
|---|---|---|---|---|---|---|---|
| GT | 2025 | 10 | 6 | 95.66 | 9.56 | 29.8 | 22.77 |
| CSK | 2023 | 15 | 9 | 93.66 | 9.36 | 35 | 22.46 |
| SRH | 2019 | 15 | 10 | 83.7 | 9.3 | 37.5 | 22.73 |
| RCB | 2023 | 14 | 12 | 64.75 | 9.25 | 34.9 | 23.8 |
| SRH | 2017 | 14 | 11 | 62 | 8.11 | 39.1 | 19.16 |
Highest run-rate in Overs 7-15 in an IPL edition
| Team | Year | Mat | RR | Wkts | Avg | Dot% | Bnd% |
|---|---|---|---|---|---|---|---|
| GT | 2025 | 10 | 9.91 | 14 | 63.71 | 22.7 | 21.25 |
| KKR | 2024 | 14 | 9.77 | 28 | 41.96 | 28 | 20.55 |
| LSG | 2025 | 10 | 9.47 | 25 | 34.12 | 29 | 19.96 |
| MI | 2025 | 11 | 9.29 | 23 | 39.13 | 29.2 | 20.79 |
| RCB | 2024 | 15 | 9.26 | 40 | 30.95 | 25.9 | 17.06 |